

Nine stages, one shared picture. How a cross-campus committee mapped where undergraduates get stuck, from first college search to life as an alum.
My role: Co-lead, Student Digital Experience Committee. My UX team synthesized the input and designed the map.
Partners: Undergraduate Education, IT Services, and Student Affairs and Success, with advisors, registrar, and financial aid staff.
Methods: Stakeholder workshops, interviews with students and advisors, journey mapping, systems inventory.
Timeline: Fall 2024 to March 2026. Map presented to the Undergraduate Advising Council and the Transforming Advising subcommittee.
The Challenge
A UCSC undergraduate student uses dozens of websites, portals, and offices between applying and graduating. Each one is owned by a different unit. Admissions, advising, the registrar, financial aid, housing, and the colleges all do their part well. But no one owned the whole picture.
That had a cost. Tools were bought one at a time to solve one unit’s problem. Processes grew around the tools, and the tools grew around the processes. Students had to piece it all together themselves, often at the moments when it was most inconvenient.
In our first workshops, the group agreed on one problem statement: “Fragmented processes, technology, systems, data, and communications create barriers to student success, and also impede staff from working effectively and fully contributing their expertise.”
Three campus leaders charged our committee to change that. Our first job was to make the whole experience visible.
Why It Matters
The stakes are high across higher education. Meeting Students Where They Are reports that 25% of students start an application but never submit it, 96% say a high-quality digital experience matters to their satisfaction, and 40% of first-time students leave before finishing two terms.
The EDUCAUSE 2026 Students and Technology Report points the same way. Students describe hard-to-navigate portals, broken links, too many sign-ins, and too many systems. They want one simple, consistent experience instead of relearning each tool.
We heard the same things at UCSC.
The Approach
The Student Digital Experience Committee brought together the university registrar, the assistant vice provost for advising and success, leaders in program advising and college student life, and IT Services. We began with three workshops to learn each other’s pain points and agree on a shared problem. I co-led the committee and our UX team ran the mapping work.
Set the scope. We focused on undergraduates: first-year, transfer, returning, part-time, and international students, plus the staff who support them.
Gathered input. We interviewed students and advisors and ran working sessions where committee members added what they saw in their own areas.
Inventoried the systems. We cataloged more than 50 systems and tools that students and staff use, organized by a higher education capability model.
Synthesized and drew the map. Our team turned the input into one map in Miro, then shared drafts with the committee and other groups for feedback.
The Map
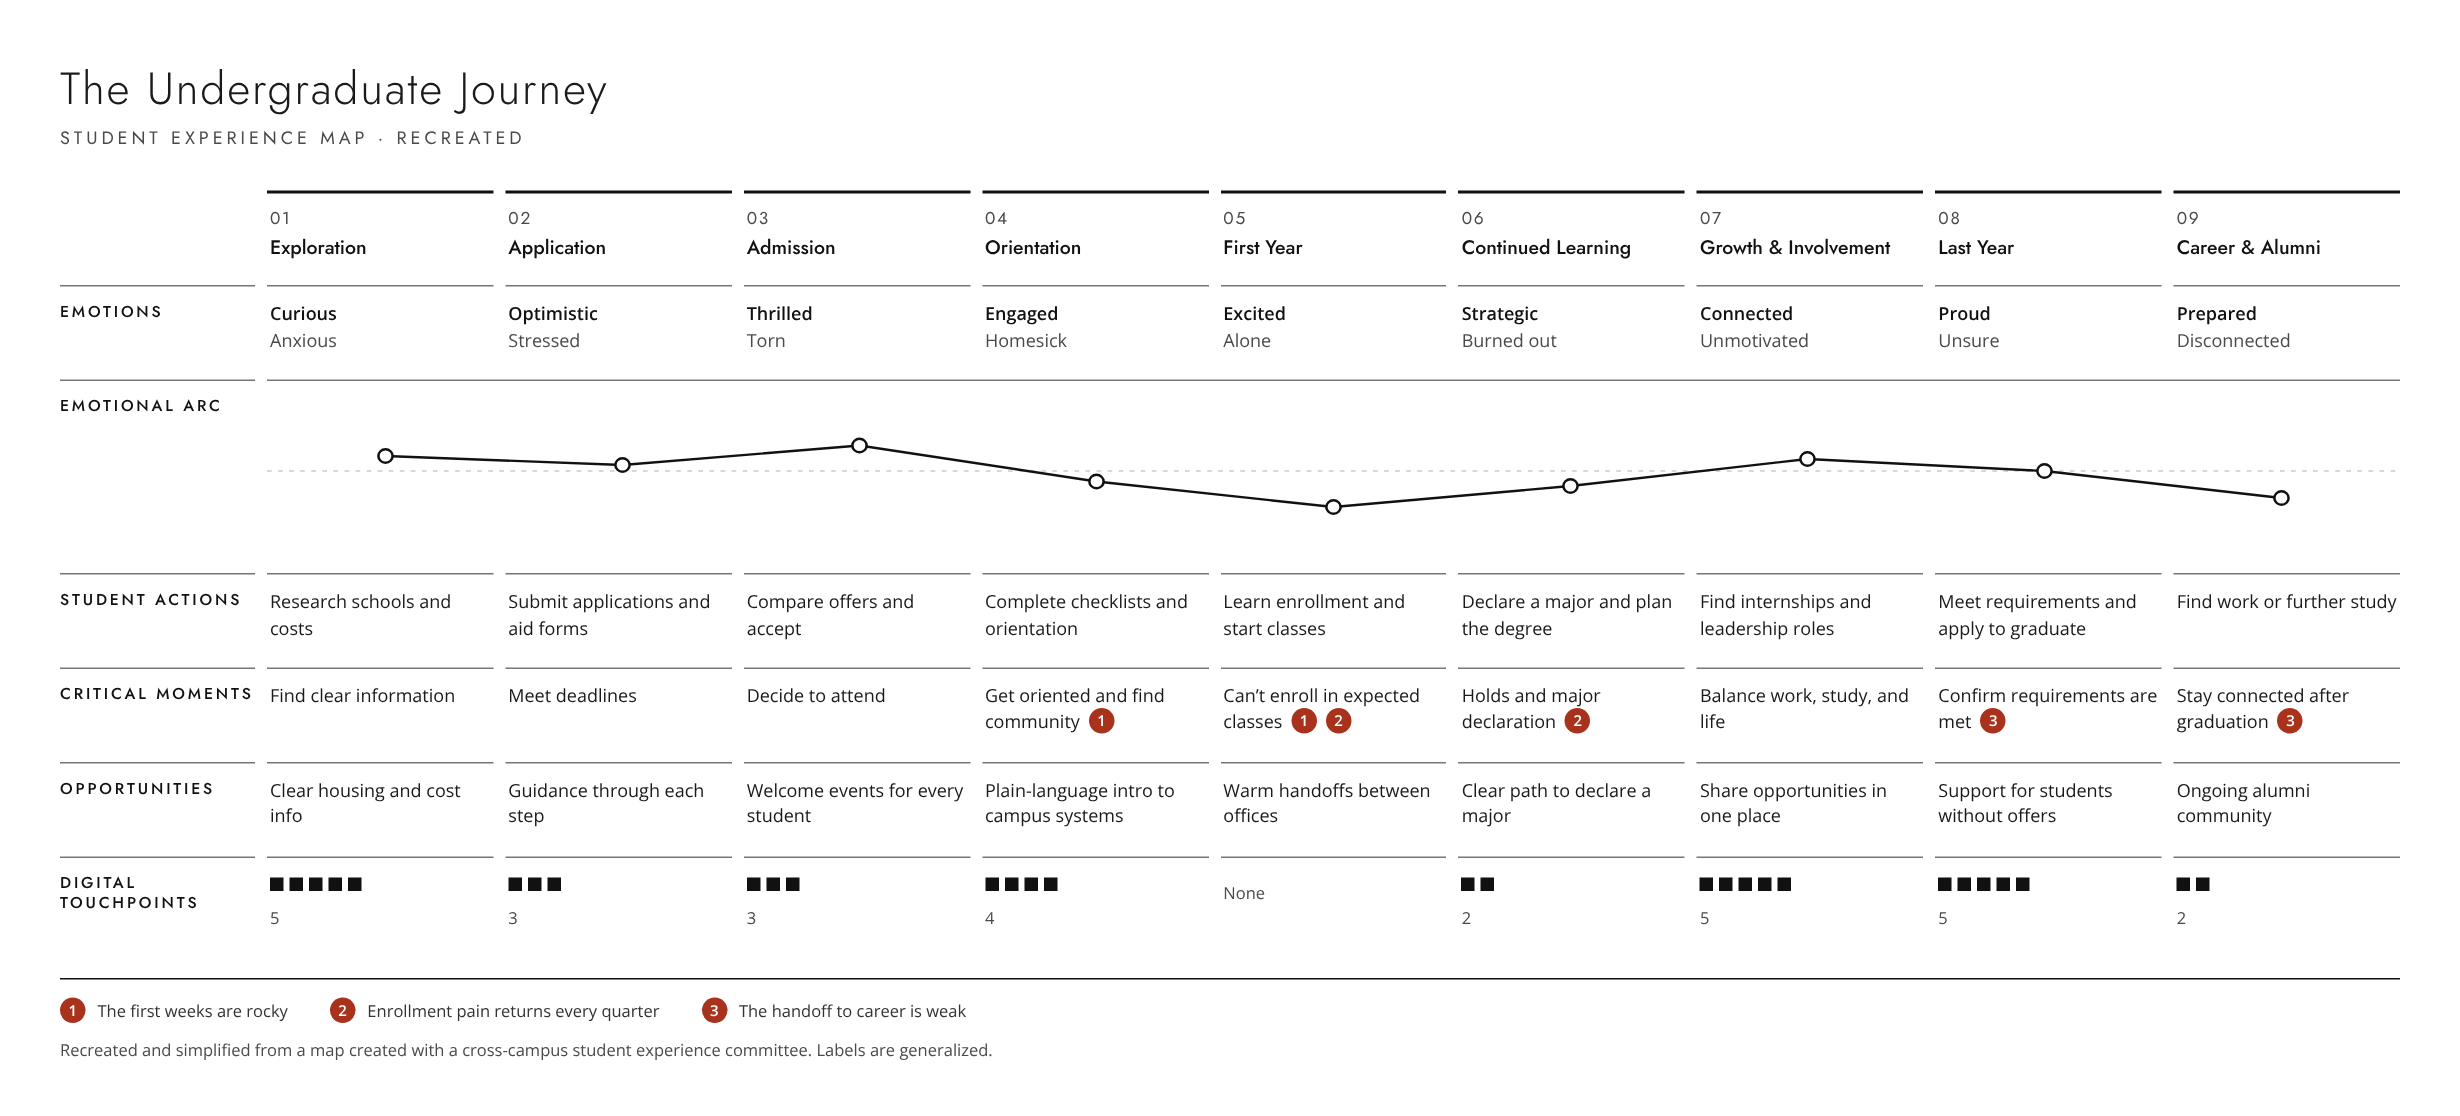
The map follows a student through nine stages: Exploration, Application, Admission, Orientation, First Year, Continued Learning, Growth and Involvement, Last Year, and Career and Alumni.
For each stage it shows five layers:
Emotions: how students feel when things go well and when they don’t
Actions: what students need to do
Critical moments: the points where a student can get stuck or drop out
Opportunities: what the campus could do better
Digital touchpoints: the websites, portals, and tools involved
What the Map Revealed
1. The first weeks are rocky. Students arrive excited, then feel alone, confused, and homesick. Many described imposter syndrome. Finding community and getting oriented runs across four stages, not one orientation week. The first year has more digital touchpoints than any other stage, right when students feel most alone. More tools did not mean more support.
2. Enrollment pain comes back every quarter. Students can’t get into the classes they expect. Holds block them. Declaring a major looks simple to a student but crosses many offices and systems behind the scenes. Committee members saw that much of the work ahead sat in two columns: enrollment and continuing.
3. The handoff from graduation to career is weak. Students in their last year described feeling lost and unsure. After graduation, many felt disconnected and lost their community. The touchpoints thin out after graduation.
The EDUCAUSE report found the same friction: too many steps, too many systems, and a wish for consistency. It also found that satisfaction with campus Wi-Fi lags other technology services. Our campus technology survey found the same thing.
How It Was Used
Our early findings won endorsement and staff time from Undergraduate Education, Student Affairs and Success, and IT Services. The working group became a formally charged committee.
Presented to the Undergraduate Advising Council, the Student Affairs communications team, and the Transforming Advising subcommittee, which is building a more student-centered advising structure.
Helped the committee focus on advising, onboarding, and enrollment as the areas with the most impact.
Shaped a new consultation process. Instead of collecting requests, the committee now works with units early to define the problem before choosing a tool.
Informed roadmap prioritization.
What I Learned
You can’t improve things without first understanding them. This map was a conversation starter, not an answer. People saw their own work in context for the first time. One member said they were “intrigued and horrified.” Once the problems were on one page, they were hard to ignore.
Altitude mattered a lot. If the altitude is too high, the map says nothing new. Too low and it becomes crowded and unreadable. To solve this problem, we kept the main map high level and planned zoomed-in maps for areas like onboarding.
A map can’t fix a lack of ownership. The hardest problems were not about tools. They were about decades of isolated processes and systems.
Why This Matters Beyond UCSC
Most campuses face the same pattern: strong units, separate systems, and no one who owns the student’s whole journey. A shared journey map is a low-cost way to start. It gives leaders, staff, and IT one picture to work from, and it puts the student at the center of decisions about technology.